In this post, I will share a brief and concise JMeter Introduction for you. I hope you will enjoy reading this post to get information about the fundamentals of JMeter.
JMeter Introduction – What is JMeter?
Apache JMeter is an Apache project that can be used as a load testing tool for analyzing and measuring the performance of a variety of services, with a focus on web applications. JMeter can be used as a unit test tool for JDBC database connections, FTP, LDAP, Web services, JMS, HTTP, generic TCP connections, and OS Native processes.
JMeter can also be configured as a monitor, although this is typically considered an Adhoc solution instead of the advanced monitoring solution. It can be used for some functional testing as well. JMeter supports variable parametrization, assertions (response validation), per-thread cookies, configuration variables, and a variety of reports. JMeter architecture is based on plugins. Most of its “out of the box” features are implemented with plugins. Off-site developers can easily extend JMeter with custom plugins. (ref: Wikipedia.org)
Jmeter Features
- JMeter %100 pure java, open-source application
- Designed for Load/ Performance/ Stress Testing
- You can write your own script
- Simulate heavy loads
- Visual feedback
- Distributed Testing
- Support different protocols, HTTP, Ftp, Ldap, Soap
- Multi-platform support
- Multithreading
- Caching & Offline Analysis
General Flow
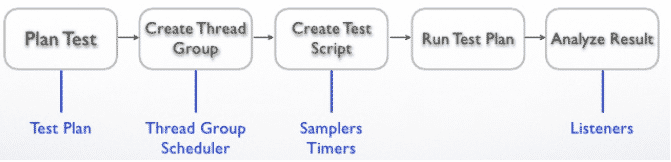
Test Plans consist of:
- Thread Groups
- Samplers
- Logical Controllers
- Listeners
- Timers
- Assertions
- Configuration Elements
- Pre- processors
- Postprocessors
JMeter Modes
1- GUI Mode
2- Server Mode
3- Command Line Mode
1- GUI Mode: After download and extract it, you can find it inside this path: “/bin/jmeter.bat”
2- Server Mode: Server Mode is used for distributed testing, use the client-server model.
3- Command Line Mode(non-GUI mode): If you have limited memory don’t want GUI frozen, you can use this mode. Go to the bin folder of your JMeter installation from the command prompt, type the following command:
jmeter -n -t D:\TestScripts\script.jmx -l D:\TestScripts\scriptresults.jtl
-n [This specifies JMeter is to run in non-GUI mode]
-t [name of JMX file that contains the Test Plan]
-l [name of JTL file to log sample results to]
JMeter Directory Structure
JMeter automatically finds classes from jars in the following directories:
- JMETER_HOME/lib: used for utility jars
- JMETER_HOME/lib/ext: used for JMeter components and plugins
Folder structure
bin: contains the .bat and .sh files for starting Jmeter. It also contains ApacheJMeter.jar and properties file
docs: the directory contains the JMeter documentation files
extras: ant related extra files
lib – contains the required jar files for Jmeter
lib/ext: contains the core jar files for JMeter and the protocols
src: contains a subdirectory for each protocol and component
test: unit test related directory
xdoc: XML files for documentation. JMeter generates documentation from XML.
Thanks.
Onur Yazir

Onur YAZIR is a Senior Software Testing & DevOps Engineer 10+ years of experience. He has worked Huawei, Ericsson, Vodafone, Several FinTech companies, Gulf News, and Emirates Airlines. You can find detailed information about him on his linked-in page.
Hi
I will like to learn how to use this software but I seem to get stuck with the version of java . So this is the error message that I kept on getting
$ /usr/local/Cellar/jmeter/3.3/bin/jmeter ; exit;
Error: Java version is too low to run JMeter. Needs at least Java >= 1.8.0.
logout
Saving session…
…copying shared history…
…saving history…truncating history files…
…completed.
Deleting expired sessions…13 completed.
Please can you assist me with this issue
Would you open command prompt and type “java -version” and enter. If you do not have JAVA version 1.8.x then you need to update JAVA.