Hi all, in this article I will explain how to import IIS logs to Elasticsearch (ES) by using Logstash and monitor them with Kibana. We will use Windows Server 2012 R2, CentOS 7.2 operating system for this setup.
Elasticsearch version: 2.4.0
Kibana version: 4.6.0
Logstash version: 2.4.0
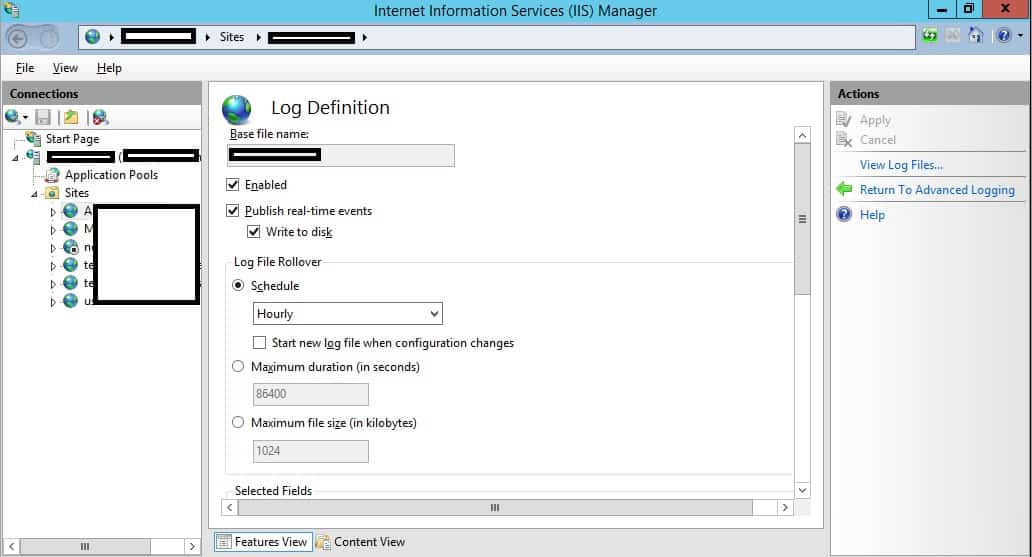
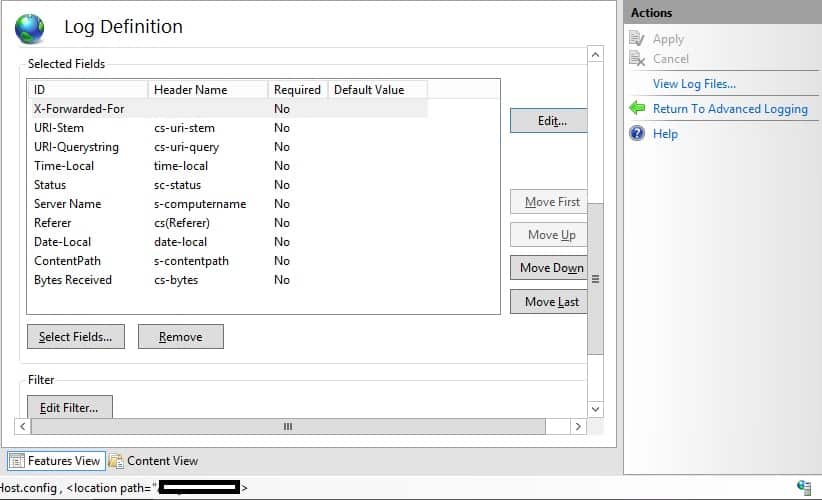
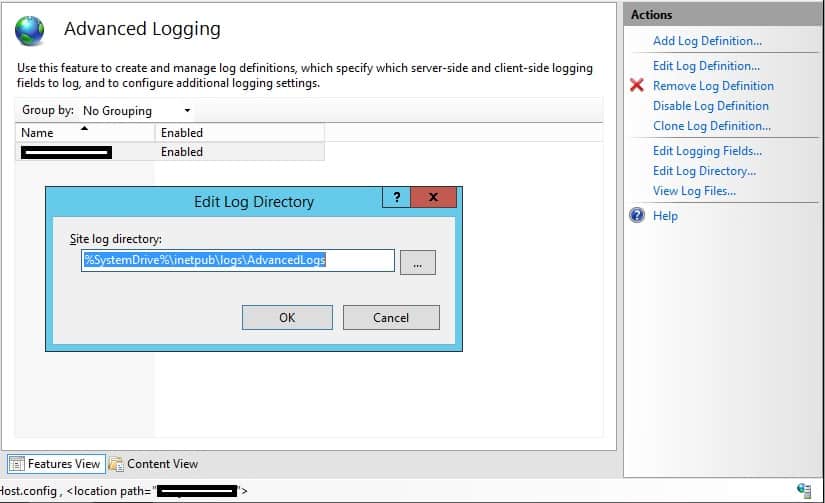
First, declare the log definitions on IIS server.
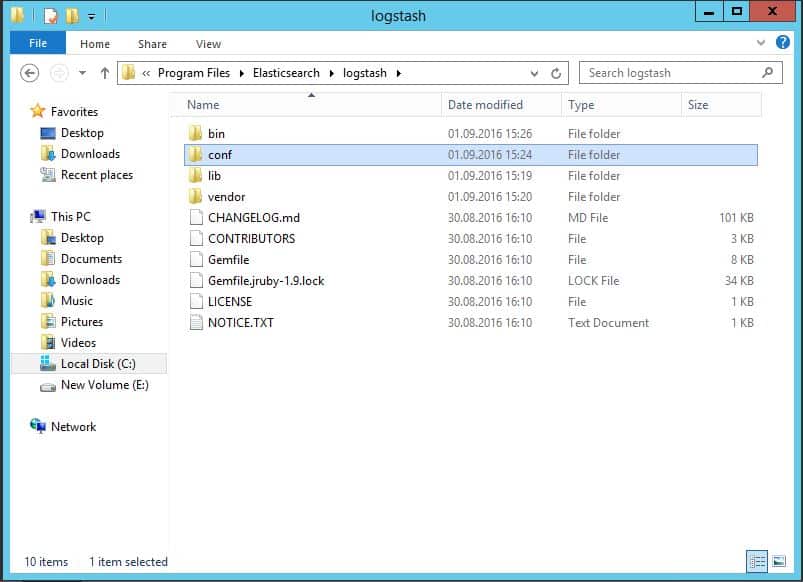
Download the Logstash from here. After that, extract it under “C:\Program Files\logstash”
Edit Logstash config as follows:
input {
 file {
 #type => "iis"
 path => "%IIS log files path%/*.log"
 start_position => "beginning"
 }
}

filter {

 #ignore log comments
 if [fusion_builder_container hundred_percent="yes" overflow="visible"][fusion_builder_row][fusion_builder_column type="1_1" background_position="left top" background_color="" border_size="" border_color="" border_style="solid" spacing="yes" background_image="" background_repeat="no-repeat" padding="" margin_top="0px" margin_bottom="0px" class="" id="" animation_type="" animation_speed="0.3" animation_direction="left" hide_on_mobile="no" center_content="no" min_height="none"][message] =~ "^#" {
 drop {}
 }


 grok {
 # check that fields match your IIS log settings
 match => ["message", "%{TIMESTAMP_ISO8601:log_timestamp} %{IPORHOST:site}
 %{WORD:method} %{URIPATH:page} %{NOTSPACE:querystring} %{NUMBER:port}
 %{NOTSPACE:username} %{IPORHOST:clienthost} %{NOTSPACE:useragent}
 %{NUMBER:response} %{NUMBER:subresponse} %{NUMBER:scstatus}
 %{NUMBER:time_taken}"]
 }

 #Set the Event Timesteamp from the log
 date {
 match => [ "log_timestamp", "YYYY-MM-dd HH:mm:ss" ]
 timezone => "Etc/UTC"
 }


 useragent {
 source=> "useragent"
 prefix=> "browser"
 }

 mutate {
 remove_field => [ "log_timestamp"]
 }
}

output {
stdout {}
elasticsearch {
hosts => ["elastisearch_server_IP:9200"]
}
stdout { codec => rubydebug }
}
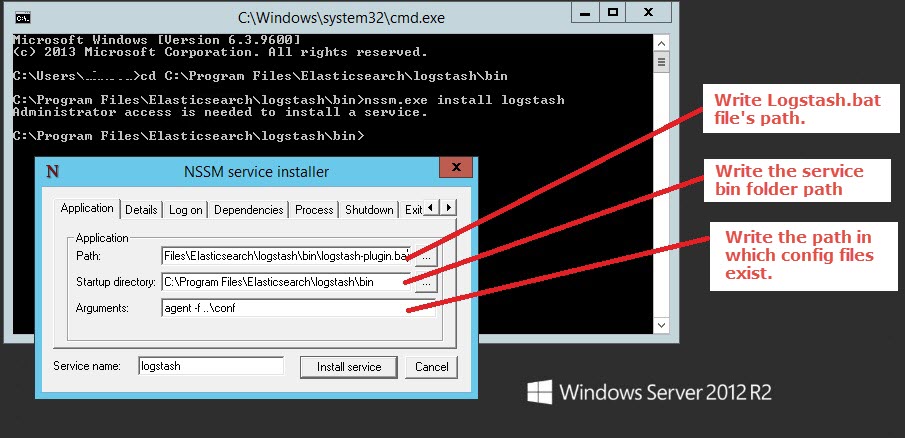
Add Logstash as a windows service with NSSM (non-sucking service manager).
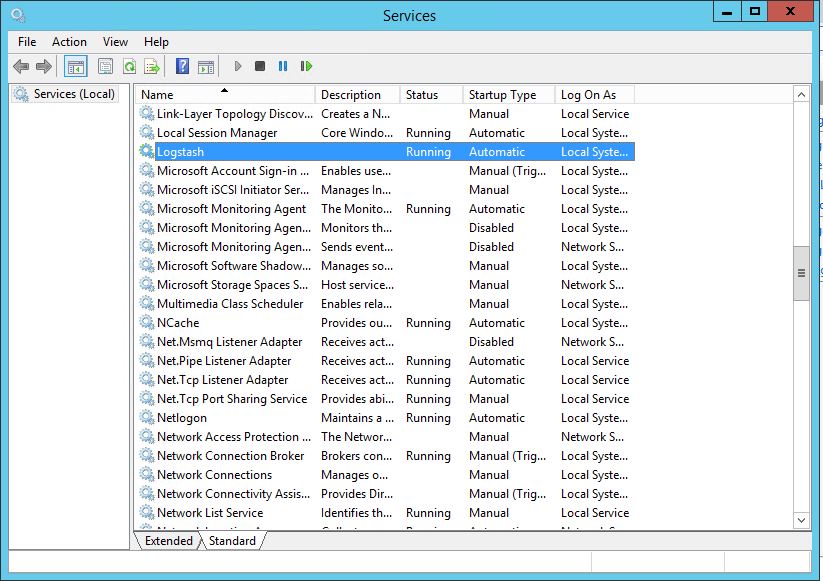
After starting Logstash service, we can go on with Kibana settings.
You can read my Elasticsearch installation article here.
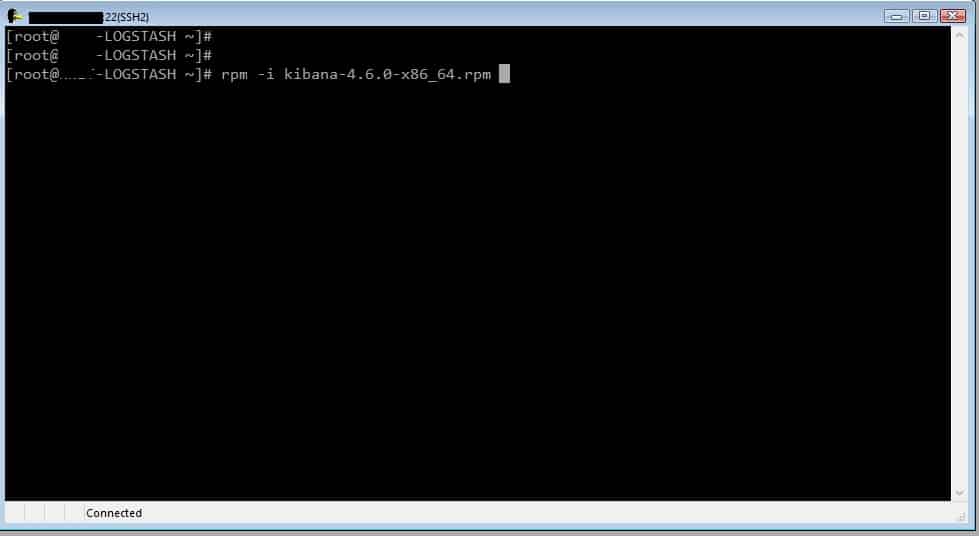
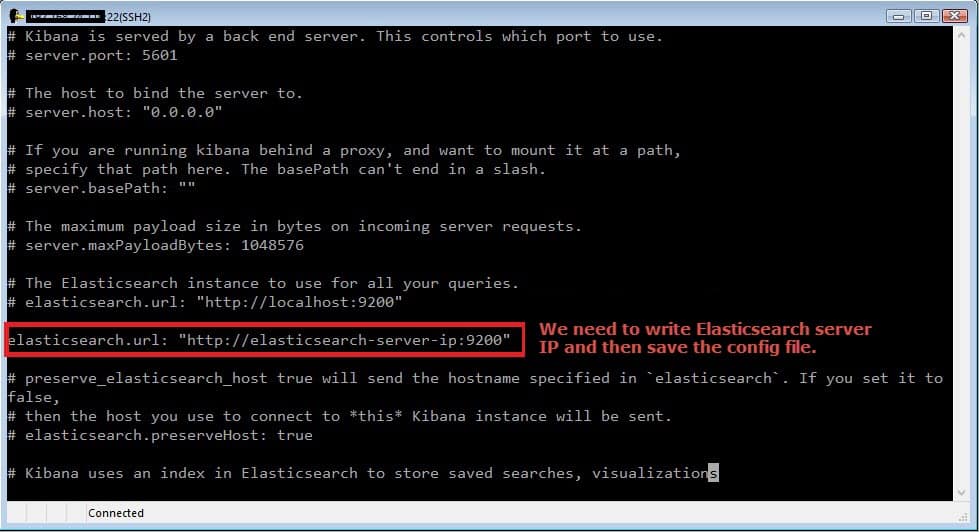
You can download Latest Kibana version from here. After installing Kibana, we need to do required settings in “opt/kibana/conf/kibana.yml” file as shown below pictures.
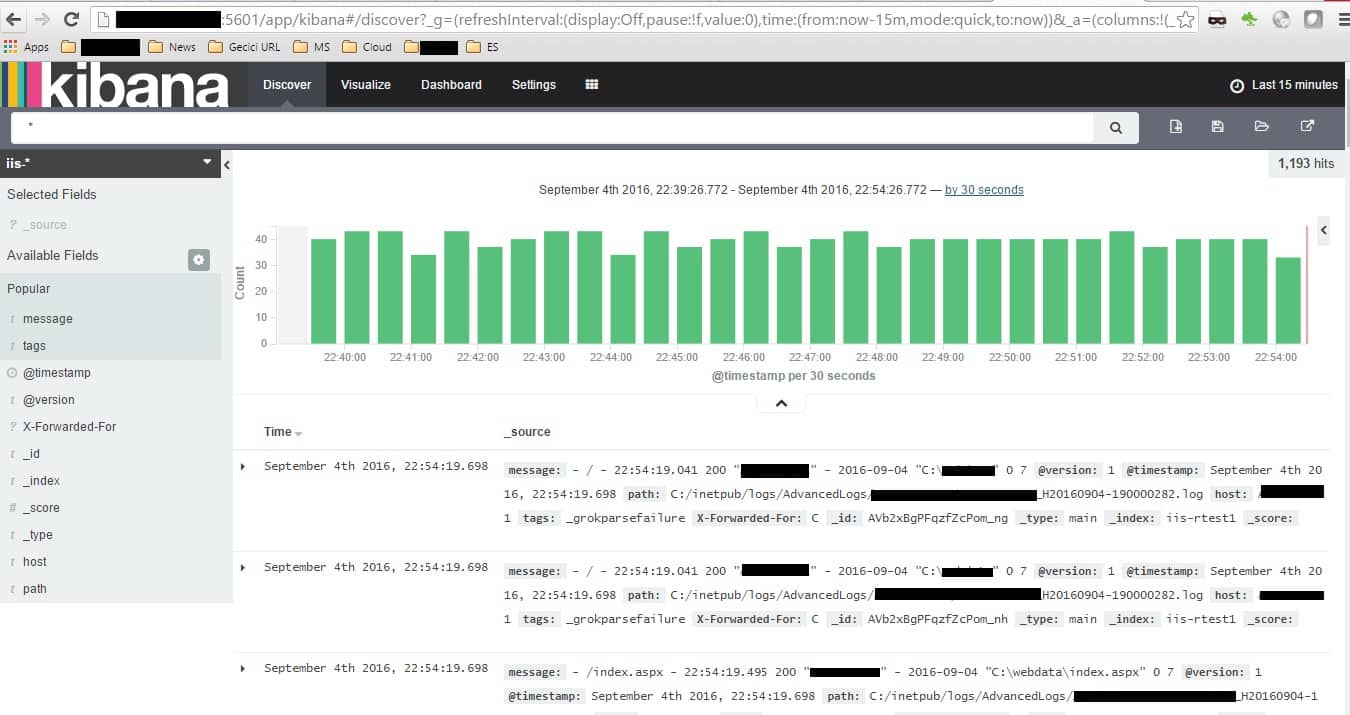
You can reach Kibana from http://kibanaserverIP:5601/app/kibana address.
 [/fusion_builder_column][/fusion_builder_row][/fusion_builder_container]

Ahmet Ay is currently Head of System and Data Management at Kariyer.net. Before, he worked at D-Smart, Doğan Online, and Escortnet as a system administrator. You can also follow him on his blog.https://ahmetfay.wordpress.com/
Your configuration above does not work. I am running logstash 2.4.0, and at the very least you need {} instead of [] in the grok match syntax. However, even with that change, I cannot get your configuration working.
Hi Greg, what extracly is wrong? this configuration works for my systems.
Nice blog